The Complete Guide to TikTok Shop Analytics: Metrics That Actually Matter
Stop drowning in TikTok Shop data. Here’s the systematic approach to tracking metrics that actually grow your business.

Most TikTok Shop sellers get overwhelmed by the platform’s analytics dashboard. We’ve analyzed millions in TikTok Shop GMV and discovered something crucial: many sellers are tracking the wrong metrics entirely.
The result?
They make data-driven decisions based on vanity metrics while missing the performance indicators that actually predict profitability and sustainable growth.
Here’s the systematic framework we use to track only the metrics that matter – and how each one directly impacts your bottom line.
Want to know how to get started on TikTok Shop? Just ask.
The TikTok Shop Analytics Hierarchy
We organize TikTok Shop metrics into four tiers based on business impact:
- Tier 1 (Critical): Revenue and profitability metrics that directly impact P&L
- Tier 2 (Strategic): Customer metrics that predict long-term value
- Tier 3 (Tactical): Content performance that drives discovery
- Tier 4 (Operational): Efficiency metrics that support sustainable growth
This hierarchy ensures you focus on metrics that actually move the needle, not just look impressive in reports.
Want to Find Out More About TikTok Shop??
Canopy’s Partners Achieve an Average 84% Profit Increase!
Let's TalkTier 1: Revenue Performance Metrics
These are the make-or-break numbers that determine TikTok Shop success.
Gross Merchandise Value (GMV)
- What it measures: Total sales value before returns and cancellations
- Why it matters: Your primary growth indicator
- Benchmark: 100%+ YoY growth for scaling brands
- How to track: TikTok Shop Seller Center → Performance → GMV Overview
GMV is your North Star metric. TikTok Shop achieved more than $33 billion globally in 2024, with successful sellers showing consistent month-over-month growth of 15-25%.
Conversion Rate by Traffic Source
- What it measures: Purchase rate from different discovery methods
- Why it matters: Shows which content types actually drive sales
- Benchmark targets:
- Short-form videos: 2-4%
- LIVE shopping: 8-12%
- Shop Tab: 1.5-3%
- Tracking method: Navigate to Analytics → Traffic Sources → Conversion Analysis
Most sellers obsess over total traffic, but conversion rate by source reveals which efforts actually generate revenue.
Return on Ad Spend (ROAS)
- What it measures: Revenue generated per dollar spent on TikTok Ads
- Why it matters: Determines advertising profitability
- Benchmark targets:
- New brands: 3:1 minimum
- Established brands: 4-6:1
- Mature campaigns: 6:1+
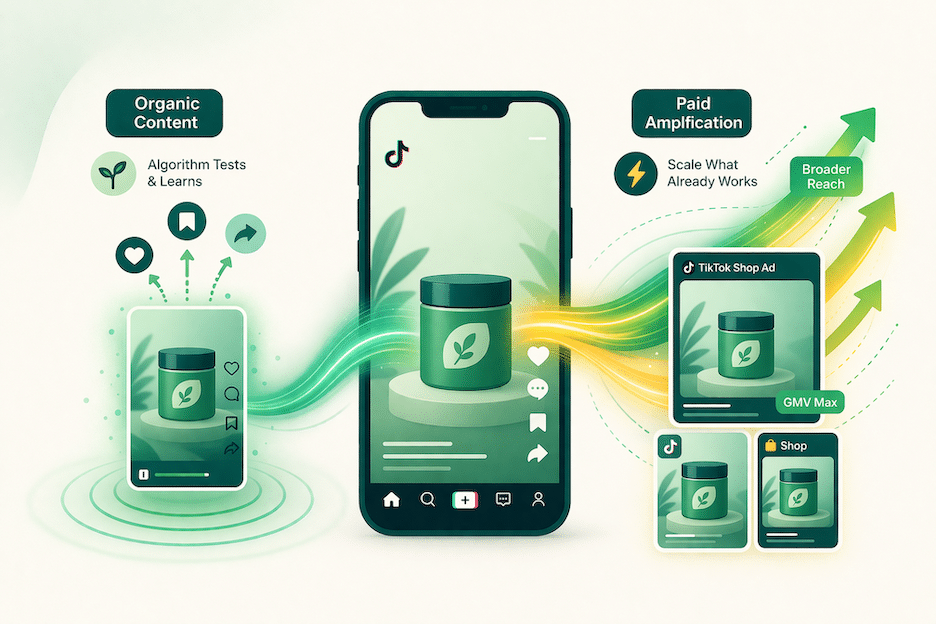
- GMV Max Performance: Track automated campaign ROAS separately from manual campaigns for optimization insights.
Average Order Value (AOV)
- What it measures: Average transaction size
- Why it matters: Higher AOV improves unit economics
- Optimization strategy: Bundle products, create urgency through limited quantities
TikTok Shop’s impulse-driven environment often produces lower AOV than Amazon, but smart bundling can increase it by 30-40%.
Tier 2: Customer Acquisition & Retention
These metrics predict long-term business health beyond immediate sales.
Customer Acquisition Cost (CAC) by Channel
- What it measures: Cost to acquire each new customer through different methods
- Why it matters: Determines sustainable growth strategies
- Calculation: (Total acquisition spend ÷ New customers acquired)
Channel breakdown:
- Organic content: $5-15
- Paid ads: $20-40
- Influencer partnerships: $15-35
Customer Lifetime Value (CLV)
- What it measures: Total revenue expected from each customer
- Why it matters: Determines how much you can spend on acquisition
- Optimization focus: Email capture, post-purchase engagement, subscription offerings
- TikTok Shop insight: 81.3% of sales come from repeat customers
Repeat Purchase Rate
- What it measures: Percentage of customers who buy again within 90 days
- Why it matters: Indicates product-market fit and customer satisfaction
- Benchmark: 25-35% for consumable products, 15-25% for durables
New-to-Brand Percentage
- What it measures: Portion of sales from first-time customers
- Why it matters: Shows brand discovery effectiveness
- Healthy balance: 60-70% new customers, 30-40% returning
Tier 3: Content & Engagement Performance
Content drives discovery on TikTok Shop, but not all engagement translates to sales.
Video Performance Metrics That Matter
Views-to-Click Rate: Percentage of viewers who engage with product links
- Good: 2-3%
- Excellent: 4-5%+
Click-to-Purchase Rate: Conversion from product click to actual sale
- Good: 8-12%
- Excellent: 15%+
Save Rate: Users saving videos for later (strong purchase intent indicator)
- Target: 3-5% of total views
LIVE Shopping Analytics
- Concurrent Viewer Peak: Maximum viewers during LIVE sessions
- Average Watch Time: Duration viewers stay engaged
- LIVE Conversion Rate: Direct sales during streaming
- Post-LIVE Sales Lift: Purchases within 24 hours after stream ends
The most successful LIVE sessions show 24-hour sales lift of 200-300% above the session’s direct GMV.
Creator Performance Tracking
When working with influencers, track:
- Creator-specific GMV: Direct sales attribution
- Engagement quality: Comments expressing purchase intent
- Cross-pollination: Followers gained from creator content
- Cost per acquisition: Total creator cost ÷ customers acquired
Tier 4: Operational Excellence Metrics
These metrics ensure sustainable growth without operational breakdown.
Shop Performance Score (SPS)
- What it measures: TikTok’s composite rating (0-5 scale)
- Components:
- Product satisfaction
- Fulfillment and logistics
- Customer service quality
- Target: 4.0+ for “Star Shop” badge
- Impact: Higher SPS increases creator collaboration rates by 35%
Fulfillment Metrics
Order Processing Time: Hours from order to shipment
- Target: <24 hours
Shipping Performance: On-time delivery rate
- Target: 95%+
Return Rate: Percentage of orders returned
- Target: <5% for most categories
Customer Service Excellence
24-Hour Response Rate: Customer inquiries answered within one day
- Target: 90%+
Resolution Rate: Issues resolved without escalation
- Target: 85%+
Customer Satisfaction Score: Post-resolution rating
- Target: 4.5+/5.0
Platform-Specific TikTok Shop KPIs
These metrics are unique to TikTok Shop’s social commerce model.
Algorithm Performance Indicators
- For You Page Placement: Frequency of product-tagged content on FYP
- Hashtag Performance: Reach and engagement by hashtag strategy
- Trend Participation: Success rate with trending sounds/effects
Social Commerce Metrics
- User-Generated Content (UGC) Rate: Customer-created content featuring products
- Share-to-Sale Conversion: Purchases driven by content sharing
- Comment-to-Purchase Rate: Sales triggered by comment interactions
Seasonal Performance Tracking
TikTok Shop shows dramatic seasonal variations:
- Q4 Performance: 200-400% GMV increase during peak shopping
- Back-to-School: Strong performance for relevant categories
- Summer/Winter Trends: Category-specific seasonal patterns
Want to Find Out More About TikTok Shop??
Canopy’s Partners Achieve an Average 84% Profit Increase!
Let's TalkAdvanced Analytics: AI-Driven Insights
TikTok’s AI tools provide deeper performance insights when used strategically.
GMV Max Campaign Analysis
Track automated campaign performance separately:
- AI-Optimized ROAS: Performance vs. manual campaigns
- Audience Discovery: New customer segments identified by AI
- Creative Performance: AI-selected ad variations vs. manual selection
Predictive Analytics
Use TikTok’s data to forecast:
- Inventory Requirements: Based on trending content performance
- Seasonal Demand: Historical patterns plus current trends
- Creator Performance: Predicted success of influencer partnerships
Cross-Platform Attribution
Track TikTok Shop’s impact on other channels:
- Brand Search Lift: Increased searches on Google/Amazon after TikTok campaigns
- Cross-Platform Sales: Customers discovered on TikTok buying elsewhere
- Long-term Brand Value: TikTok’s contribution to overall brand equity
Implementation Framework
1: Foundation (Week 1-2)
- Set up tracking for Tier 1 metrics
- Establish baseline performance benchmarks
- Configure automated reporting for critical KPIs
2: Optimization (Week 3-4)
- Add Tier 2 customer metrics tracking
- Implement cohort analysis for CLV calculation
- Set up content performance monitoring
3: Advanced Analytics (Week 5-8)
- Deploy Tier 3 and 4 metric tracking
- Integrate with external analytics tools
- Build custom dashboards for strategic insights
4: Systematic Improvement (Ongoing)
- Weekly performance reviews using the hierarchy
- Monthly deep-dive analysis on underperforming areas
- Quarterly strategic adjustments based on trends
Common Tracking Mistakes
1. Vanity Metric Obsession Tracking likes and follows instead of conversion rates and CLV.
2. Single-Channel Attribution Not measuring TikTok Shop’s impact on other sales channels.
3. Short-Term Focus Optimizing for immediate GMV instead of sustainable customer acquisition.
4. Creator Misalignment Judging influencer success only on engagement, not sales conversion.
5. Seasonal Blindness Not accounting for TikTok Shop’s dramatic seasonal variations in planning.
The Bottom Line
TikTok Shop success requires systematic tracking of metrics that actually predict growth and profitability.
Focus on the four-tier hierarchy: prioritize revenue metrics, track customer value, optimize content performance, and maintain operational excellence.
Most importantly, remember that TikTok Shop’s social commerce model requires different benchmarks than traditional e-commerce. What matters is sustainable growth driven by authentic engagement and repeat customers.
Frequently Asked Questions
How often should I check TikTok Shop analytics?
Daily for Tier 1 metrics (GMV, conversion rates), weekly for Tier 2-3 (customer and content metrics), monthly for Tier 4 (operational metrics).
What’s the minimum GMV to make TikTok Shop profitable?
Most successful sellers achieve profitability at $10,000+ monthly GMV, but this varies significantly by category and AOV.
How do TikTok Shop metrics compare to Amazon?
TikTok Shop typically shows higher conversion rates (8-12% vs 2-4%) but lower AOV. The key difference is the discovery-driven vs. search-driven customer journey.
Should I track different metrics for different product categories?
Yes. Beauty products focus on viral content metrics, while outdoor equipment emphasizes product demonstration views and creator authenticity.
How do I track cross-platform impact from TikTok Shop?
Use UTM parameters, brand search monitoring, and customer surveys to measure TikTok Shop’s influence on other channels.
What’s the biggest mistake sellers make with TikTok Shop analytics?
Treating it like traditional e-commerce. TikTok Shop requires tracking content virality, creator performance, and social engagement alongside standard commerce metrics.
Want to Find Out More About TikTok Shop??
Canopy’s Partners Achieve an Average 84% Profit Increase!
Let's TalkMaximize Your Brands Performance with Expert TikTok Shop Management
Successfully tracking and optimizing these metrics requires deep platform expertise and dedicated strategic focus – exactly what you’ll get when they work with Canopy Management’s TikTok Shop experts.
Canopy’s specialized TikTok Shop team has helped brands achieve an average 84% profit increase year-over-year by implementing systematic approaches to social commerce optimization.
We don’t just track metrics – we build comprehensive strategies that leverage TikTok Shop’s unique discovery-driven model while maintaining profitability across your entire marketplace ecosystem.
Ready to transform your TikTok Shop performance with data-driven strategies?
Our tri-platform experts (Amazon, Walmart, TikTok Shop) provide the strategic bandwidth you need to scale profitably across all major marketplaces.
Schedule your custom strategy session today and discover how we can help you navigate TikTok Shop’s complexities while building sustainable, profitable growth.
Canopy Management is a full-service marketing agency for Amazon, Walmart, and TikTok sellers. Our team consists of multi-million dollar, omni-channel entrepreneurs, industry leaders, and award-winning experts.
Want to Find Out More About TikTok Shop??
Canopy’s Partners Achieve an Average 84% Profit Increase!
Let's Talk